MetaLocator has recently begun sending monthly updates to users regarding the performance of their locators. These reports include essential performance analytics recorded in the past month, providing insights to help you optimize your locator.


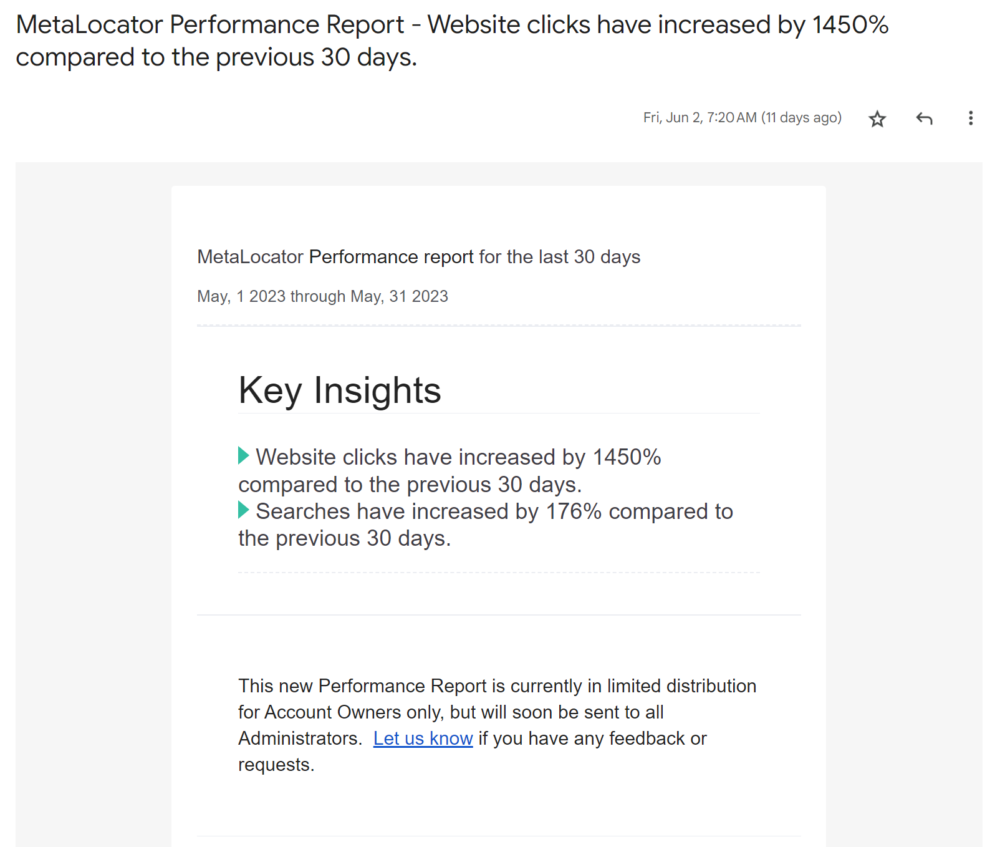
The Performance report includes automated insights regarding important changes in analytics activity. If a given metric increases or decreases dramatically, the report highlights the change under the Key Insights section. By pointing out notable changes, readers can see what specific aspects of their locator are changing the most. This allows for users to quickly see substantial changes in user activity and can provide insight regarding changes that could be made to better optimize user experience.

These performance reports are delivered to all administrators via email. The email will also contain links to any recent MetaLocator news and updates, with the goal of keeping our users best informed regarding changes and updates to our products. MetaLocator’s software is always evolving and this helps our users to have every opportunity to grow with us.
What does my performance report mean?
MetaLocator tracks an array of analytics inside each interface. To better understand the performance report, it is important to understand some of the key metrics tracked by MetaLocator.
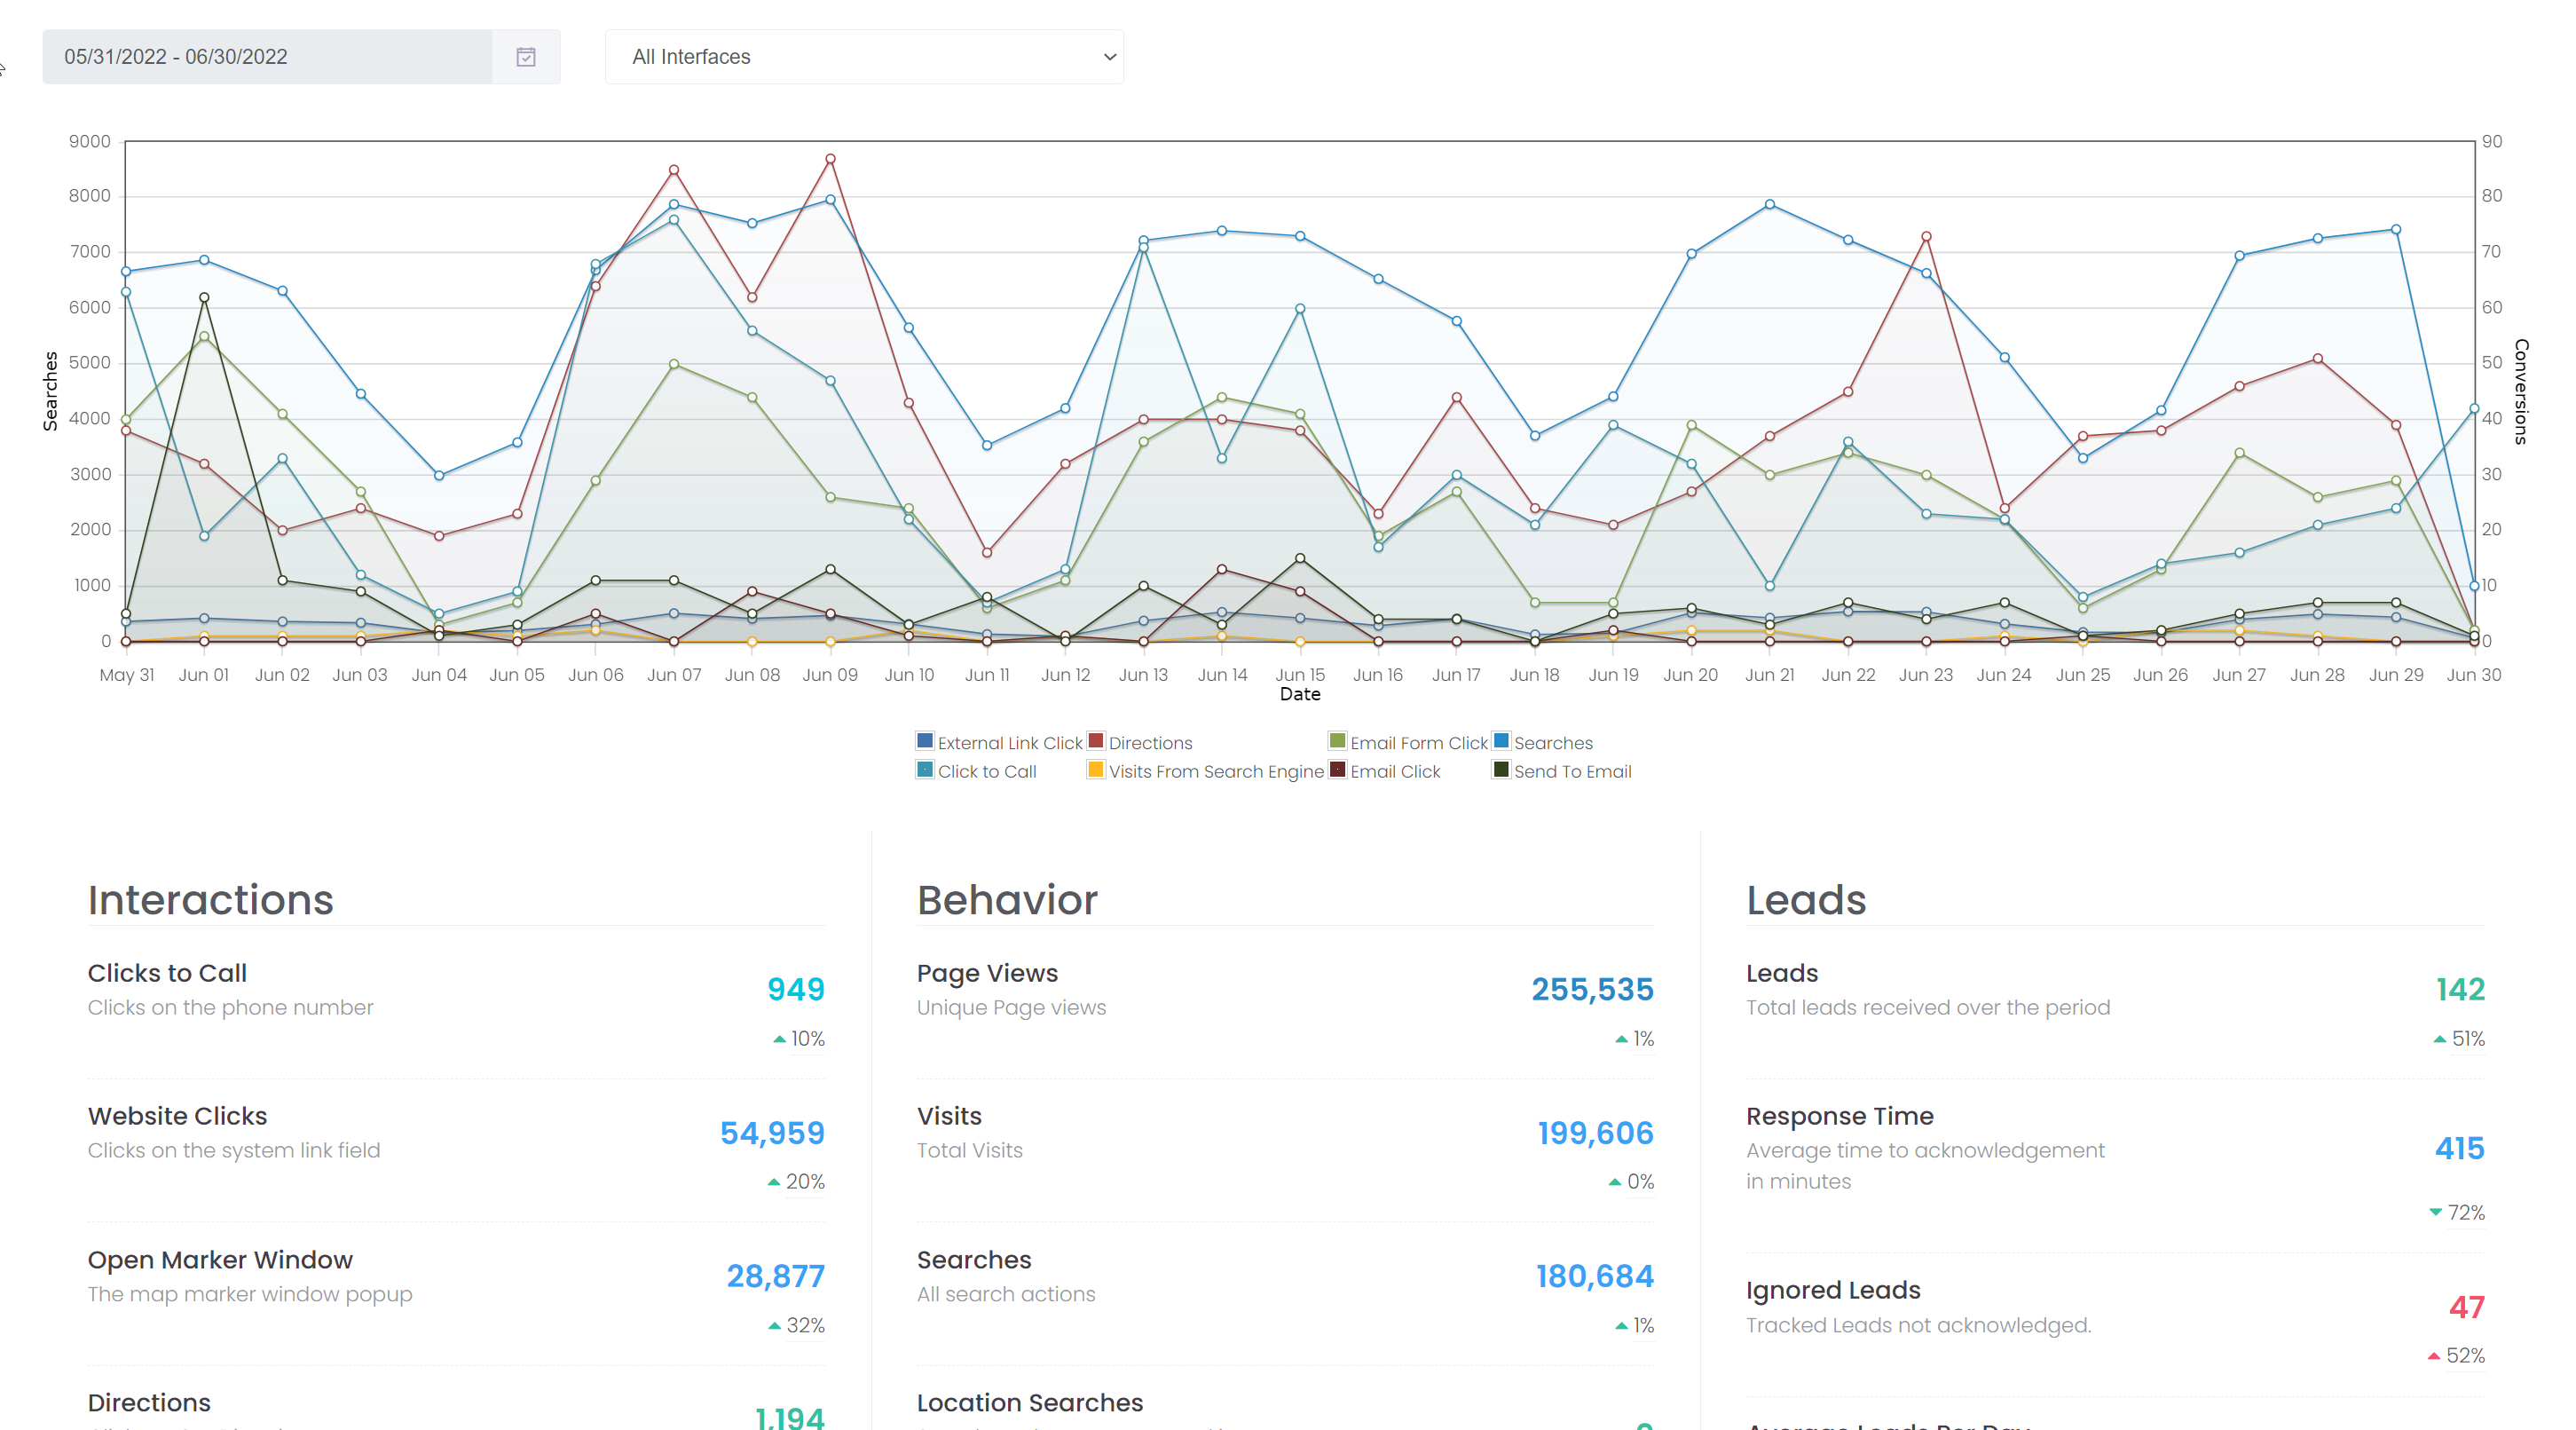
MetaLocator measures visitor activity in the locator primarily by tracking analytics events. Events record an action the user took in the locator, such as clicking a link, performing a search or clicking a phone number. Events are recorded with an Action and a Name. The Action is typically a verb representing what the user did, and the Name is a label identifying what the action was taken against. Some examples of analytic events users may see in their performance reports are Details, Search, and Click to Call.
For example, when a user performs a search within the locator it triggers an analytics event. Any time the user causes the locator to display results, a Search event is triggered.
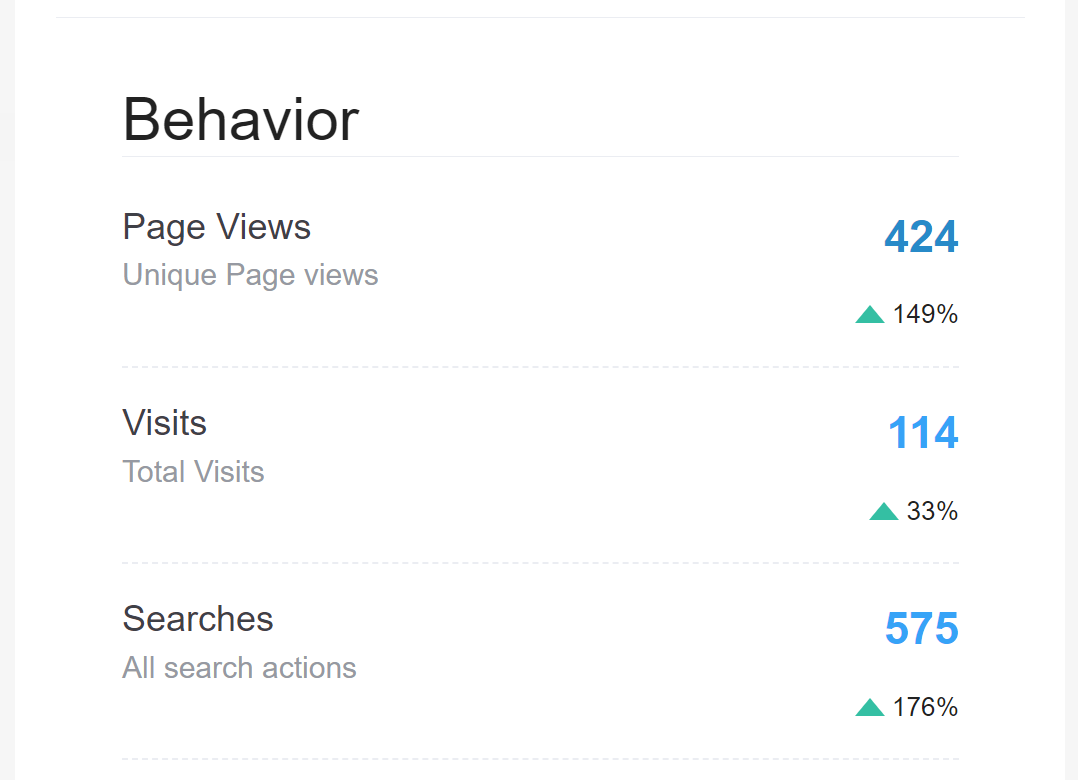
One behavior metric users can expect to see in their performance reports is Page Views. Page Views highlights the number of individuals who have viewed your locator in the last month. The report will indicate whether this number has increased or decreased from previous months with distinctively colored arrows pointing up or down. Up arrows will be green indicating an increase in page views, while down arrows will be red indicating a decrease.

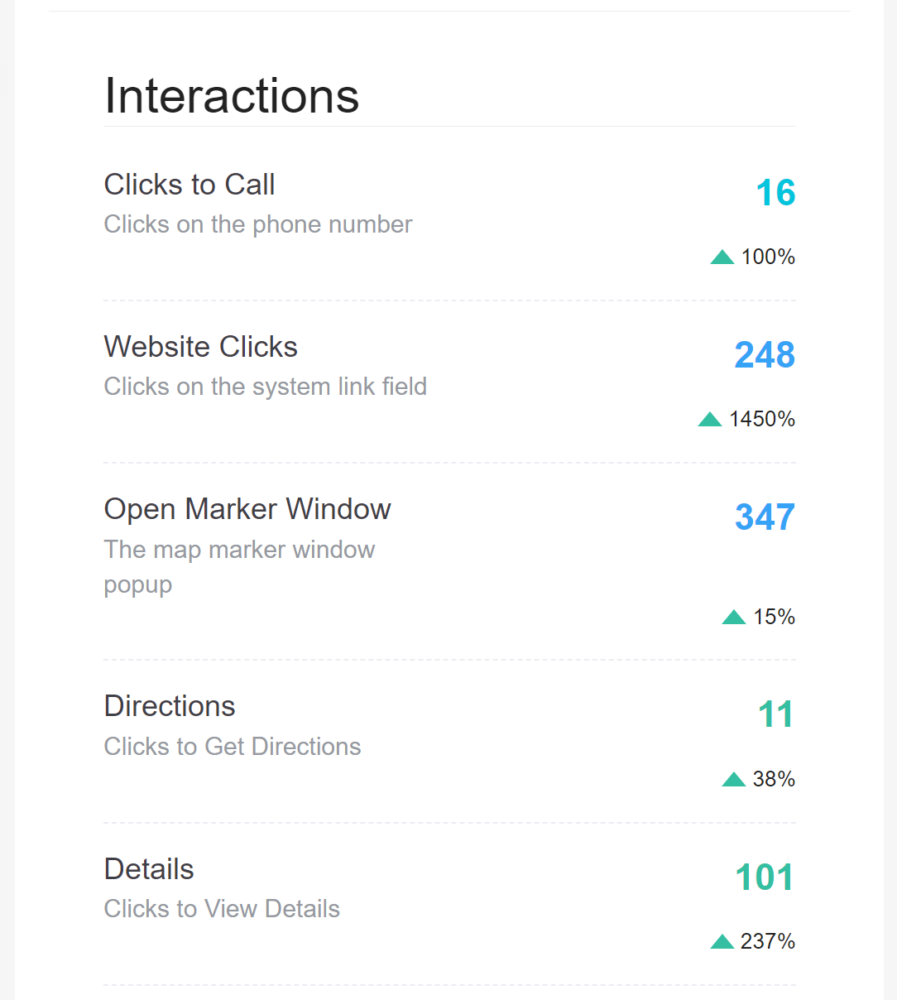
Interaction metrics can also be tracked. An example of an interaction metric is website clicks. Website clicks track how many times users interact (by clicking) within your locator. This metric will also indicate if the number of clicks are up or down with the arrows described above.

For example, if a user searches by postal code this would be a standard geographic dimension that is tracked in MetaLocator.
To learn more about MetaLocator’s product offerings, see our products page. To see the latest on MetaLocator, see our news page.

